API Data Sets
There are a lot of applications and products available today to consumers. Many of these have an API (automatic programming interface) to access the data or a website to display data from. In many cases you already have data available with consumer products via the vendors website or an API access. A simple custom app then reads the API or scrapes the data from a website and captures the data into an IoT infrastructure. This enables one common place to see and manage that data from a variety of sources. Overall, it doesn't matter then if they are physical sensors or not. An IoT framework enables many products, APIs or sensors to show data in one place.
Grafana Dashboarding
One you have all your data in an IoT framework, you build dashboard to easily view it. So, good dashboarding tools (I recommend Grafana), show data from all of your devices and sensors. Dashboards simplify your data into a representation and collection that is more meaningful. For example, here are a couple dashboards built in Grafana making it easy to have a unique view that shows everything of interest.
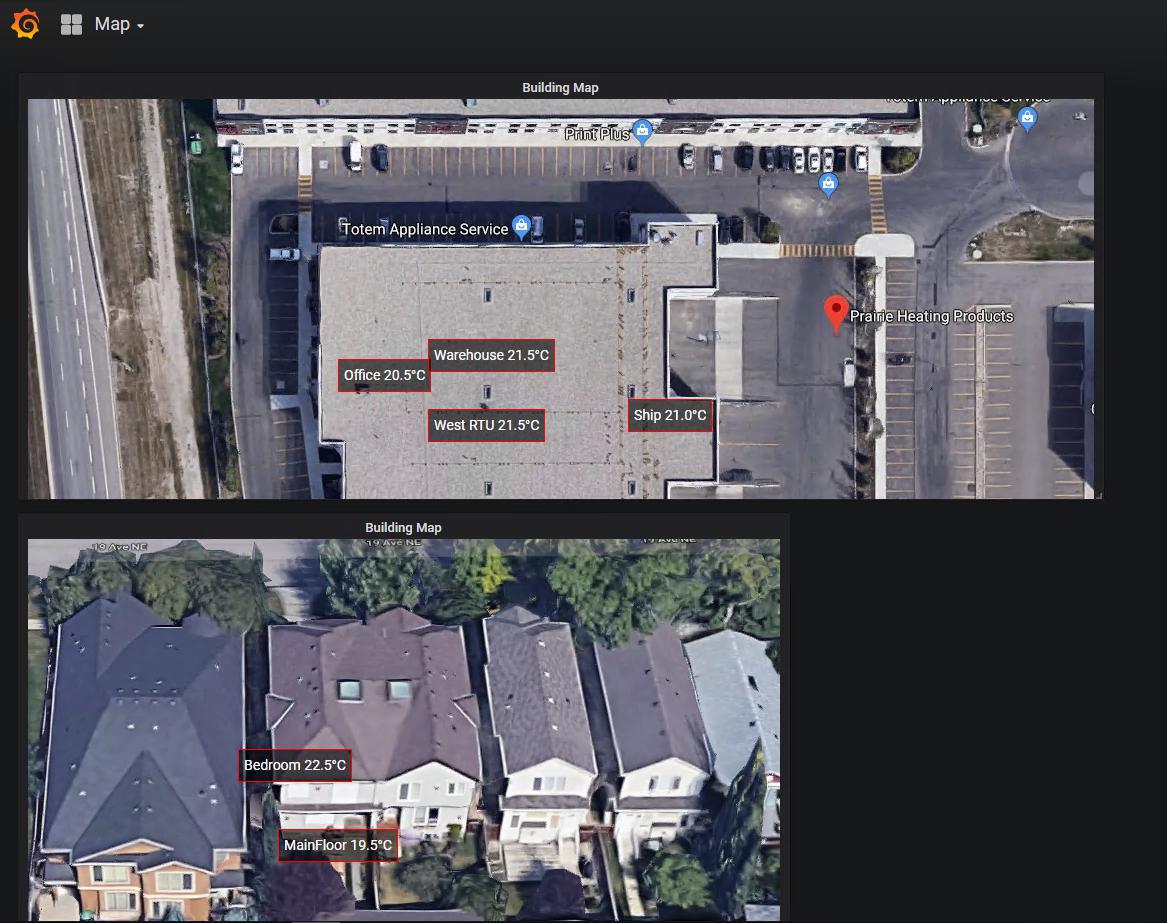
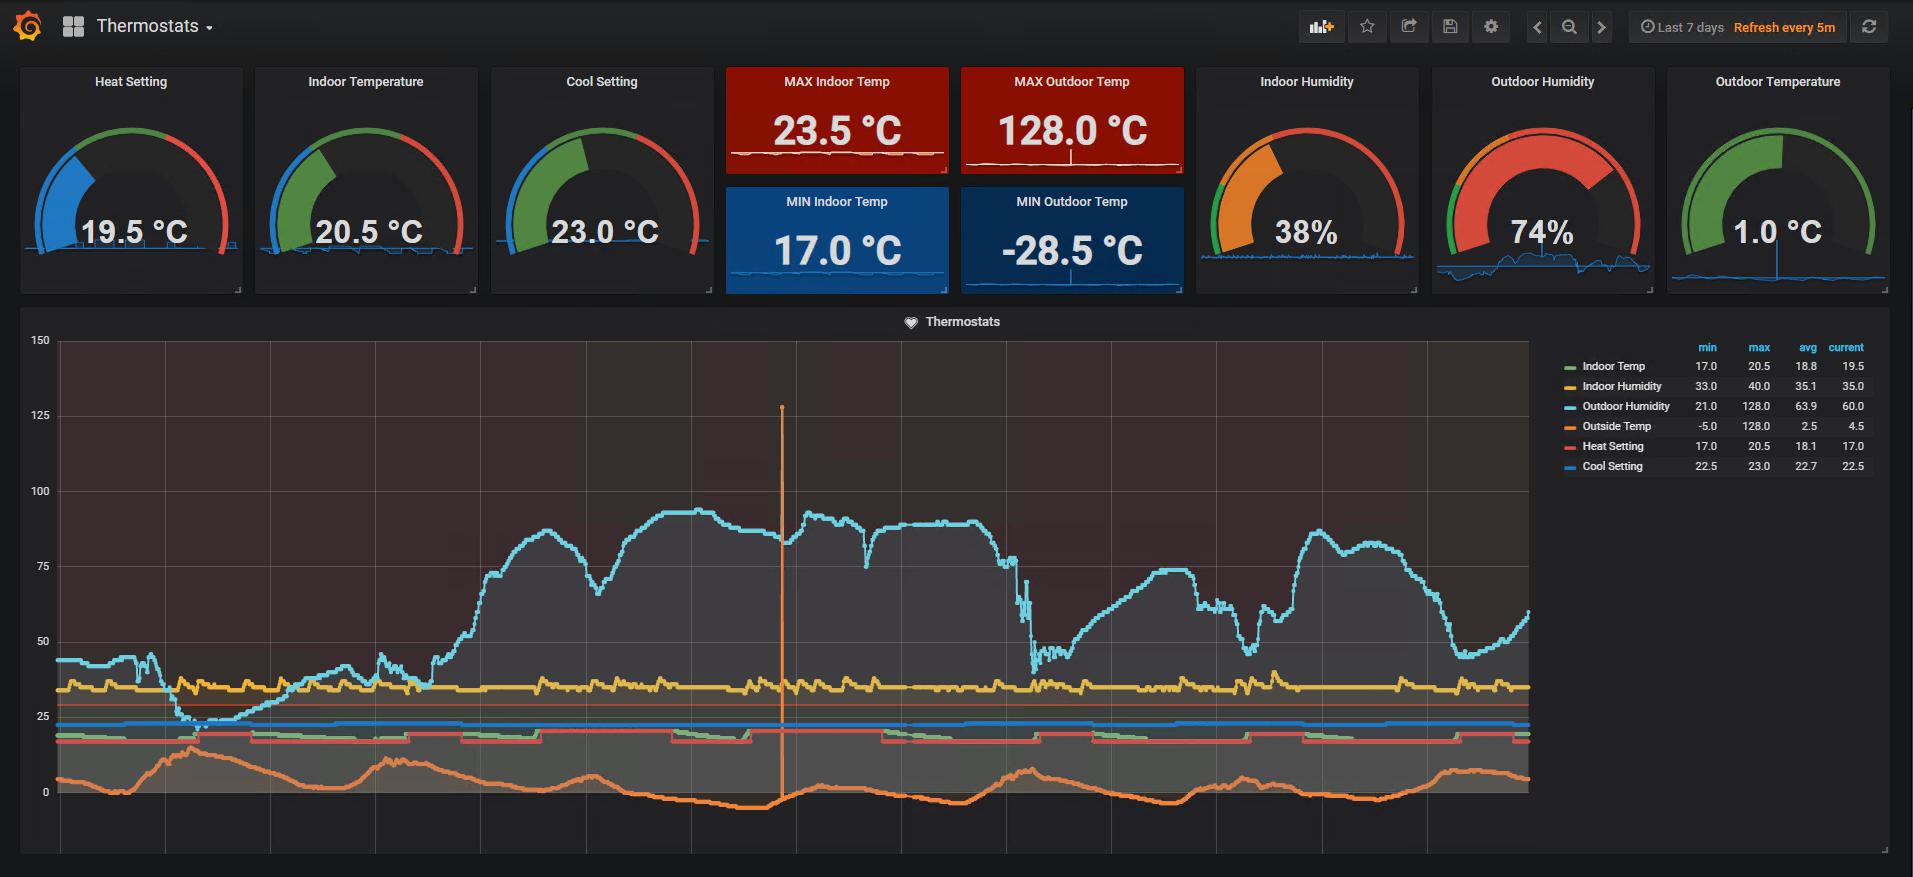
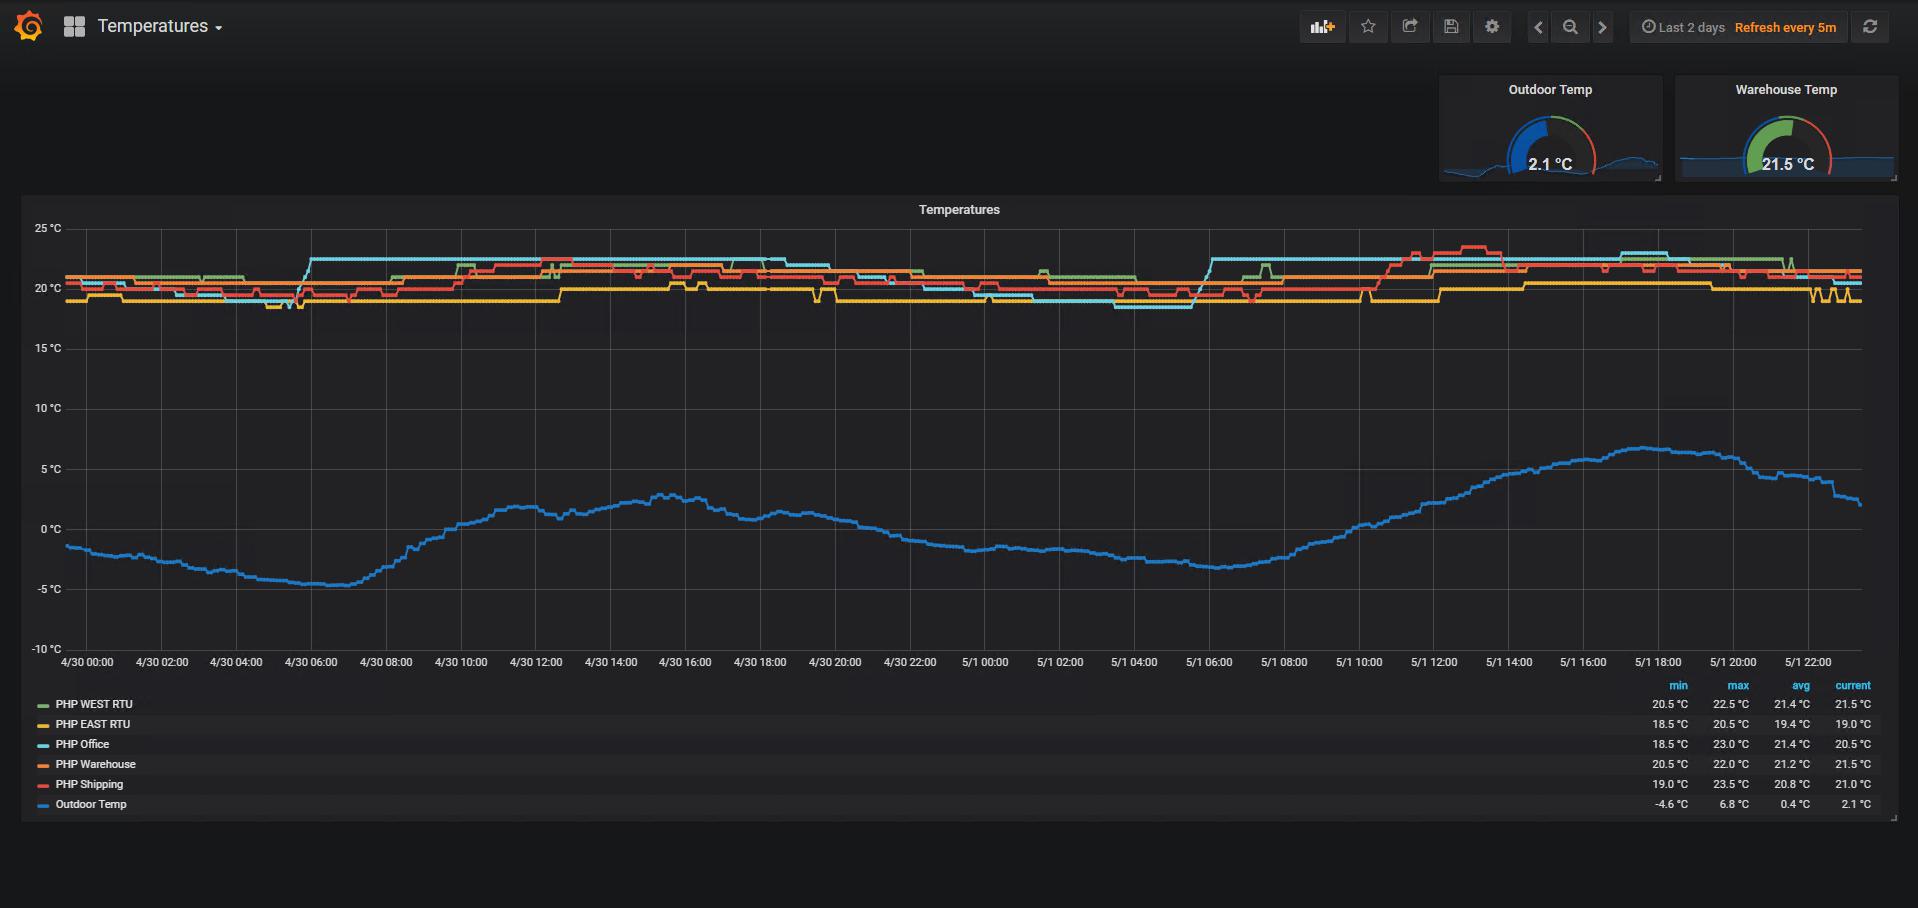
To the right, the sensors show a live data overlay on the map of the client's home and warehouse. Below, the two images show custom views with all the points of interest and data trends, which show any time range of interest.